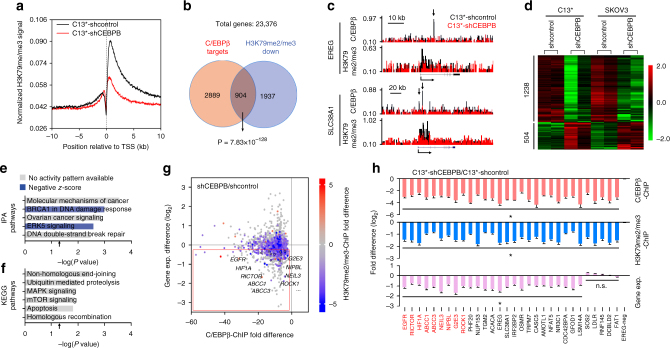
Fig. 4.
C/EBPβ modulates H3K79 methylation to reprogram gene expression. a Meta-analysis of the averaged H3K79me2/me3 ChIP-seq signals of genes across ±10 kb genomic regions flanking the TSS. b Venn diagrams showing the overlap of genes with decreased H3K79me2/me3 (C13*-shCEBPB vs. C13*-shcontrol) and C/EBPβ-targeted genes (Pearson’s chi-squared test). c Normalized C/EBPβ and H3K79me2/me3 ChIP-seq signals for the representative genes (EREG and SLC38A1). d Supervised clustering of genes that were consistently differentially expressed (P < 0.05) upon C/EBPβ knockdown in C13* and SKOV3 cells. e, f IPA of the differentially expressed genes (e) and KEGG pathway analysis of downregulated genes (f) upon C/EBPβ knockdown in C13* and SKOV3 cells. Arrows indicate P = 0.05. Negative z-scores (blue) represent the suppressed state of the function. g Scatter plot showing genome-wide changes in the values of C/EBPβ binding (x-axis), gene expression (y-axis), and averaged H3K79me2/me3 (colored) in C13*-shCEBPB vs. C13*-shcontrol. Positive and negative values reflect increases and decreases, respectively. h Analysis of C/EBPβ ChIP-qPCR (pink), H3K79me2/me3 ChIP-qPCR (blue), and RT-qPCR (purple) in C13* cells. Gene names in red indicate documented cisplatin-resistance genes in ovarian cancer. *P < 0.05; n.s. not significant

