Fig. 2.

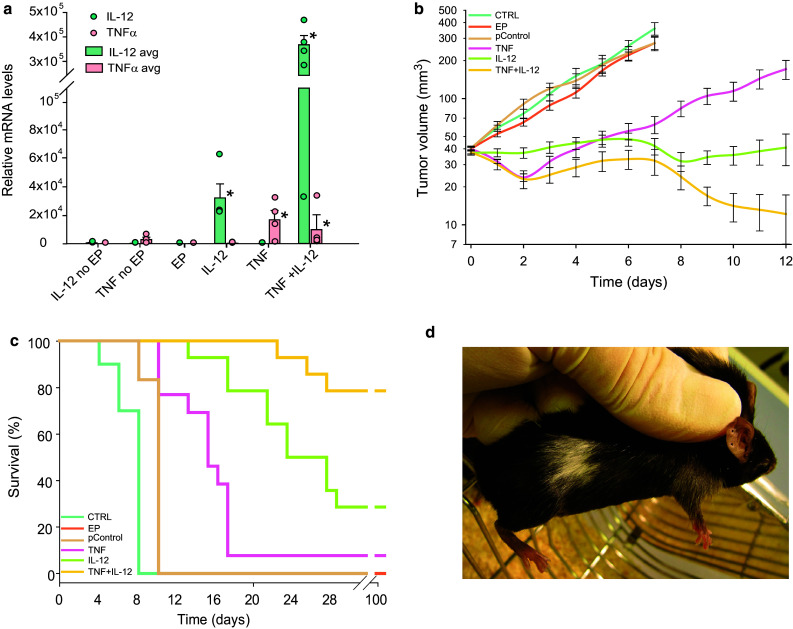
Expression and therapeutic effectiveness after TNFα and IL-12 GET in B16-F10 murine melanoma tumors. a Expression of IL-12 and TNFα as determined by RT-PCR 2 days after GET. Circles represent expression in the individual tumors; Bars represent the mean level of expression with the standard error of the mean of 5 mice per experimental group. b Growth of the treated tumors. Data were pooled from 2 independent experiments with 5–6 animals in each experimental group and are presented as the mean with the standard error of the mean. A tumor volume of 300 mm3 was pre-set as the humane endpoint of the experiment. c Survival of the treated animals. A Kaplan–Meier survival plot was constructed with a tumor volume of 300 mm3 counted as the endpoint event. d Vitiligo, local discoloration of the fur at the treatment area, observed in all the cured mice. EP application of electroporation only, IL-12 no EP injection of IL-12 plasmid without EP, TNF no EP injection of TNFα plasmid without EP, TNF TNFα GET, IL-12 IL-12 GET (repeated twice), TNF + IL-12 TNFα and IL-12 GET, pControl GET of a control plasmid (pControl)
