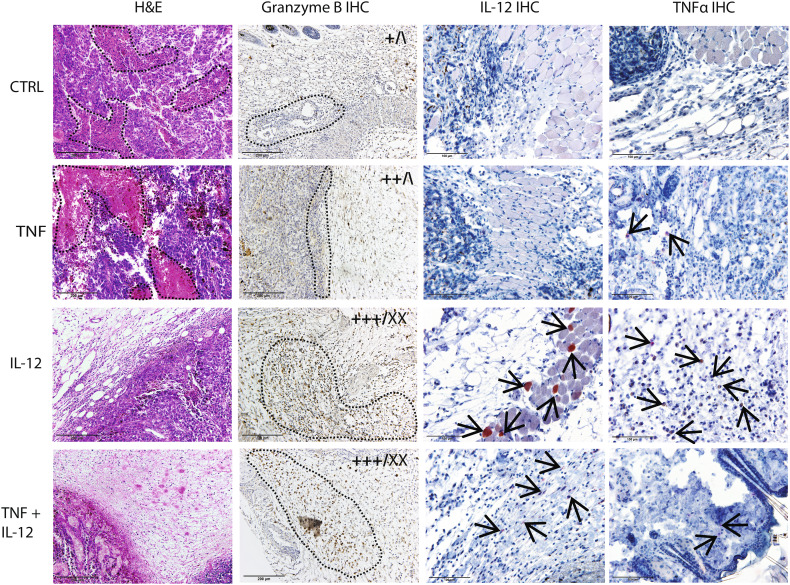
Fig. 3.
Representative images of histological tumor sections in the control group (CTRL), after TNFα (TNF) and IL-12 (IL-12) GET, and after GET of both plasmids (TNF + IL-12). Sections were stained with hematoxylin and eosin (H&E, first column) or for granzyme B (second column), IL-12 (third column), and TNFα (forth column) positive cells. The infiltration of immune cells and the abundance of granzyme B-positive cells were scored using a semi-quantitative method. Scoring results are shown on the upper right corner of the representative images as follows: left, infiltration; right, granzyme B-positive cells. – – –, necrosis in column 1; lymphocyte infiltration in column 2; →, positive muscles, fibroblasts and macrophages in columns 3 and 4; +, low infiltration; ++, high infiltration; +++, very high infiltration; \, no granzyme B-positive cells; X, low frequency of positive cells; XX, high frequency of positive cells. Images were taken by a DP72 CCD camera (Olympus, Tokyo, Japan) connected to a BX-51 microscope (Olympus)

