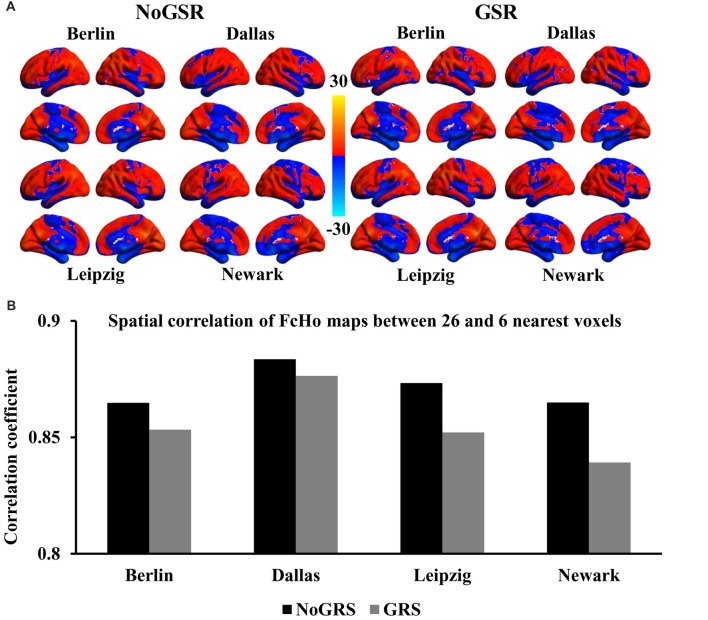
Figure 3.
Whole brain FcHo mapping using the nearest six neighbors. (A) FcHo maps were also calculated using the nearest six neighborhood voxels using fMRI data with and without GSR (GSR and NoGSR) to test the effect nearest voxels, and similar spatial distribution patterns were obtained. (B) Spatial correlation coefficients were calculated between FcHo maps obtained with 26 and six nearest voxels by using NoGSR and GSR fMRI data in all the four datasets, respectively.

