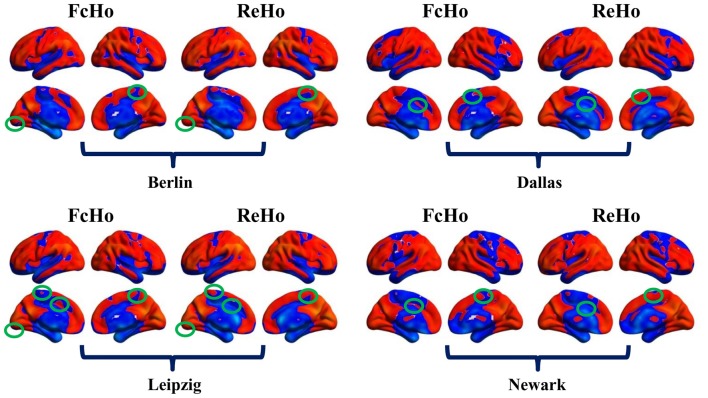
Figure 6.
Differences between whole brain FcHo and local ReHo mapping using the nearest 26 neighbors. Besides the similar distribution patterns between FcHo and ReHo, we also identified different distribution patters in primary visual cortex, paracentral lobule, supplementary motor area and middle cingulate cortex. FcHo method more sensitively identified lower FcHo values in primary cortex (such as visual cortex, paracentral lobule and supplementary motor area in this study) and higher FcHo values in association cortex (such as middle cingulate cortex in this study) than ReHo method.

