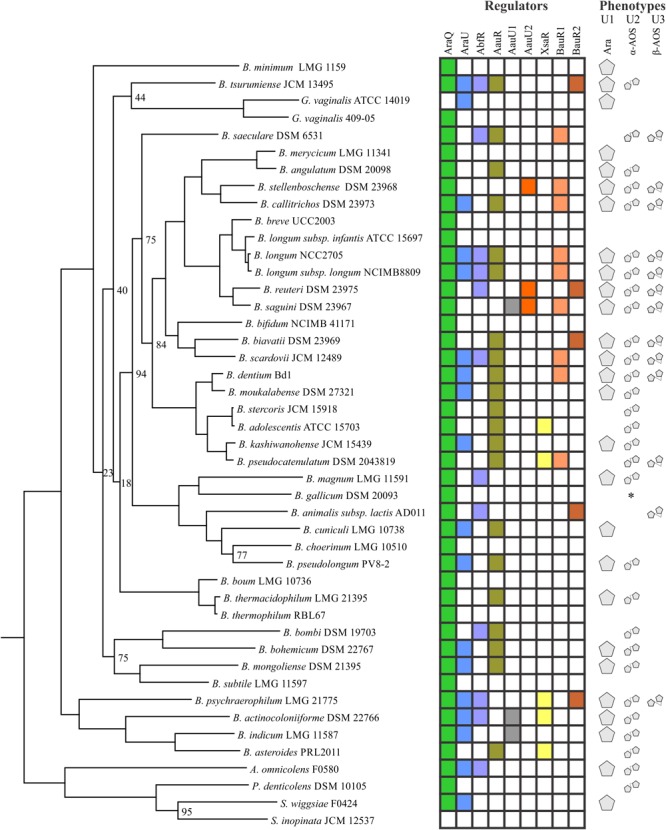
FIGURE 2.

Distribution of arabinose/AOS utilization regulators and predicted growth phenotypes in Bifidobacteriaceae. The presence of a particular TF is shown with a colored rectangle. Predicted arabinose, α- and β-AOS utilization phenotypes are schematically represented as pentagons. The special case of arabinose utilization in B. gallicum is marked with an asterisk and discussed in the text.
