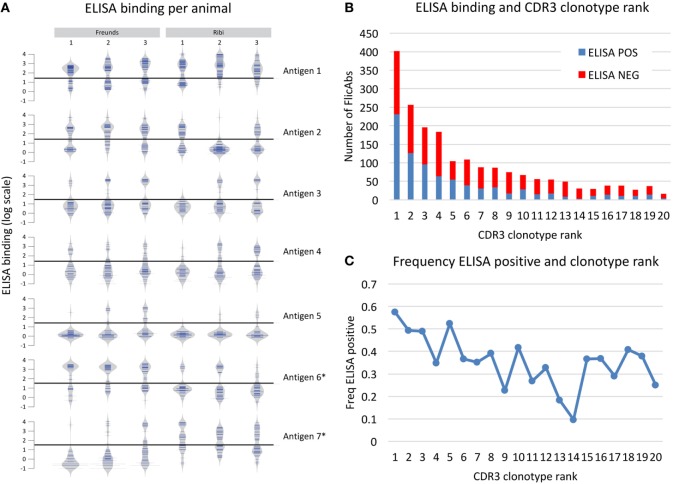
Figure 4.
Antigen binding measured for 2,560 monoclonal FlicAbs. (A) Individual bean plots show the distribution of antigen-binding signal for 42 representative animals (6 animals immunized with 7 different antigens). The y-axis shows log transformed ELISA binding signal (fold-over background), and the horizontal line marks the threshold used for calling a FlicAb antigen positive or negative. The left three vertical columns are animals immunized with Freund’s adjuvant, and the right three columns are animals immunized with Ribi adjuvant. Each row is a different antigen. (B) The distribution of clonotype abundance (CDR3 clonotype rank) of the FlicAbs tested are shown as stacked bars where the red bar indicates ELISA negative FlicAbs and the blue indicates ELISA-positive FlicAbs. The y-axis indicates total FlicAb counts, and the x-axis category designates the abundance rank of the CDR3 clonotype. (C) The frequency of ELISA-positive FlicAbs categorized by abundance rank is shown. The y-axis indicates the frequency of ELISA positive, and the x-axis category designates the abundance rank of the CDR3 clonotype.

