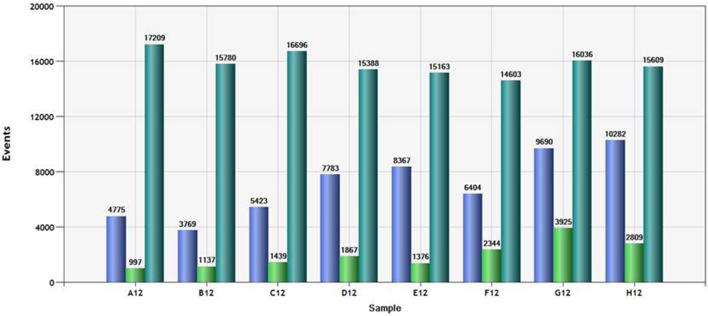
Figure 2.
Total count and channel specific droplet count for a typical column of samples. Droplets positive for at least one “T allele” (green bar), positive for at least one “C allele” (“blue bar” and total number of droplets (positive and negative) are shown for each of the samples in the plate column.

