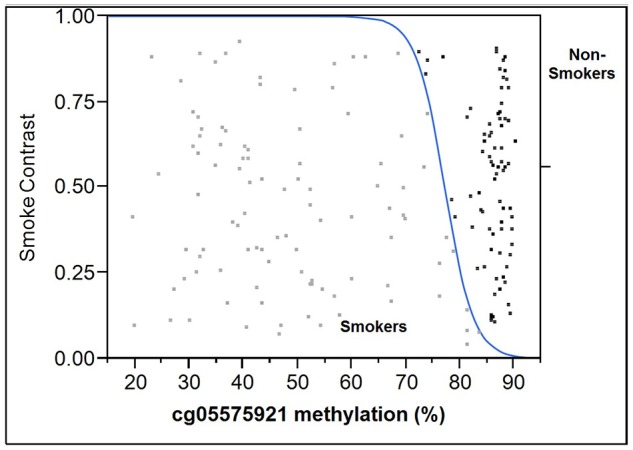
Figure 4.

Logistic plot of the relationship of cg05575921 methylation to smoking status. The results from the smokers (n = 99) are in light gray and are to the left of the blue curve while the results from the non-smoking subjects (n = 78) are black and are to the right of the blue curve.
