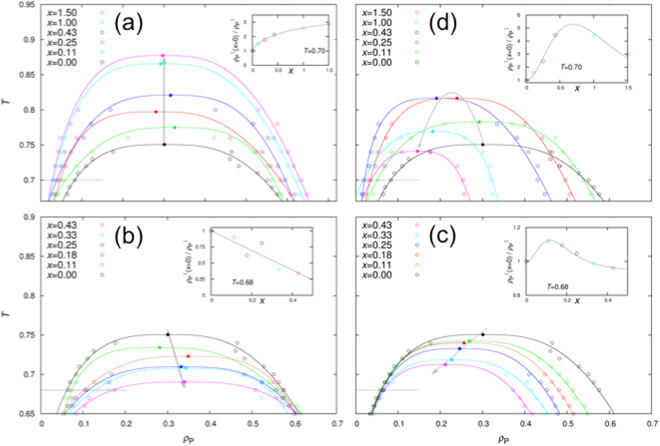
Figure 2.
Phase diagrams. Results at εPR = 0.0, 0.5, 1.0, and 1.35 are shown in (a–d), respectively. Open symbols are calculation results, and solid curves are fits to equation (7). The critical points from the fits are shown as filled symbols, with an arrowed gray line or parabola indicating the change with increasing X. A horizontal line through the left arm of the binodal indicates the temperature chosen for displaying results in the inset here and also in subsequent figures. Inset: ratio of threshold P concentrations between the pure P system and P-R mixture; a smooth curve is drawn to guide the eye.

