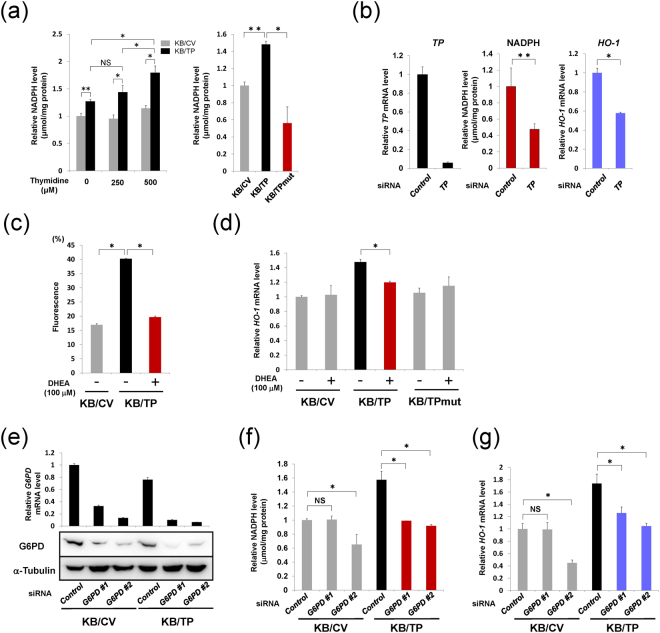
Figure 2.
Effect of TP on Intracellular levels of NADPH (a) NADPH levels in KB/CV and KB/TP cells incubated in the absence or presence of thymidine at 250 or 500 μM for 48 h (left). Effect of TP activity on NADPH levels in KB cells. NADPH levels in KB/CV, KB/TP and KB/TPmut cells treated with or without 500 μM thymidine for 48 h were determined (right). NADPH levels in KB/CV and KB/TP cells were measured using a NADPH assay kit. (b) Effect of TP knockdown on TP mRNA (left), NADPH (middle), and HO-1 mRNA (right) levels in Yumoto cells. (c) ROS levels in KB/TP cells treated with DHEA for 24 h. (d) Expression levels of HO-1 mRNA were determined by real-time PCR in KB/CV, KB/TP, and KB/TPmut cells treated with DHEA for 48 h. (e) KB cells were transfected with G6PD siRNA or negative control siRNA. The levels of G6PD mRNA (upper) and G6PD protein (lower) were determined by real-time PCR and immunoblotting, respectively. (f) Effect of downregulation of G6PD on NADPH levels in KB cells. KB cells transfected with G6PD siRNAs were treated with 500 μM thymidine for 48 h, and NADPH intracellular levels were determined. (g) Effect of downregulation of G6PD on HO-1 mRNA levels in KB cells. Data are presented as mean ± SD. ∗P < 0.01, ∗∗P < 0.05.

