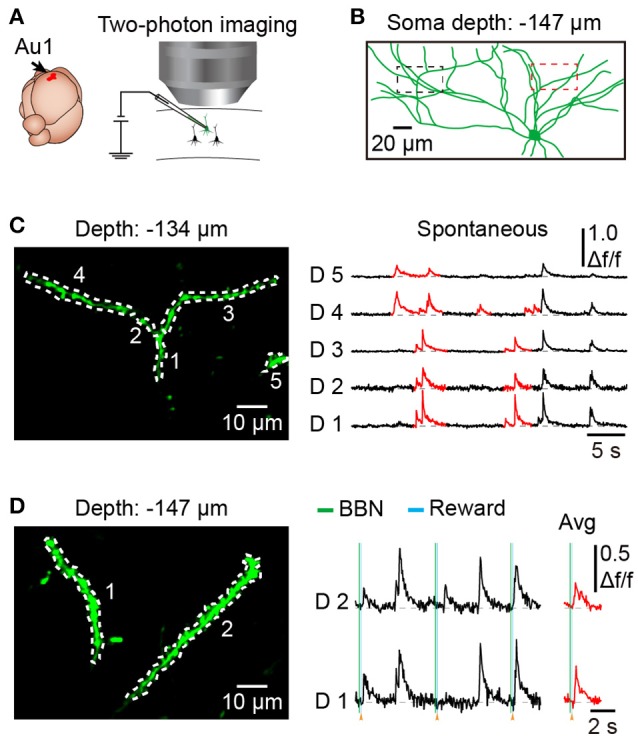
Figure 5.

Dendritic Ca2+ imaging using electroporation in the Au1 of behaving mice. (A) Schematic of electroporation in the Au1. (B) Reconstruction of an electroporated neuron in the Au1, labeled with OGB-1. (C) Spontaneous Ca2+ transients from 5 dendritic shafts (outlined in left part of B). Local Ca2+ transients are marked in red. (D) Dendritic Ca2+imaging from a region of the neuron during behavior (outlined in right part of B). Average Ca2+ transients related to the BBN are marked in red.
