
FIGURE 4.
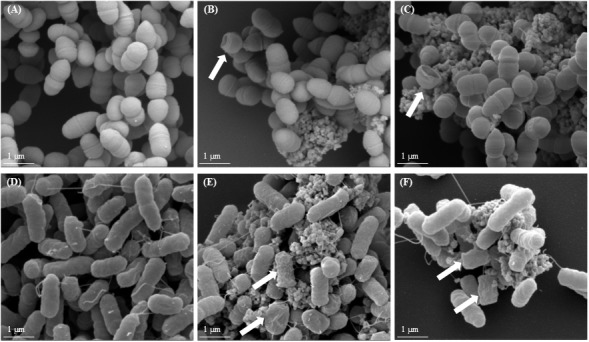
Scanning electron microscopy (SEM) images of bacterial cells after TiO2 exposure. (A,D) non-exposed growing bacterial cells, (B,E) growing bacterial cells exposed to E171-A 320 μg/mL, and (C,F) growing bacterial cells exposed to E171-D 320 μg/mL; (A–C) L. lactis IBB477, (D–F) E. coli K12 MG1655. White arrows indicate damaged bacterial cells.