FIGURE 2.

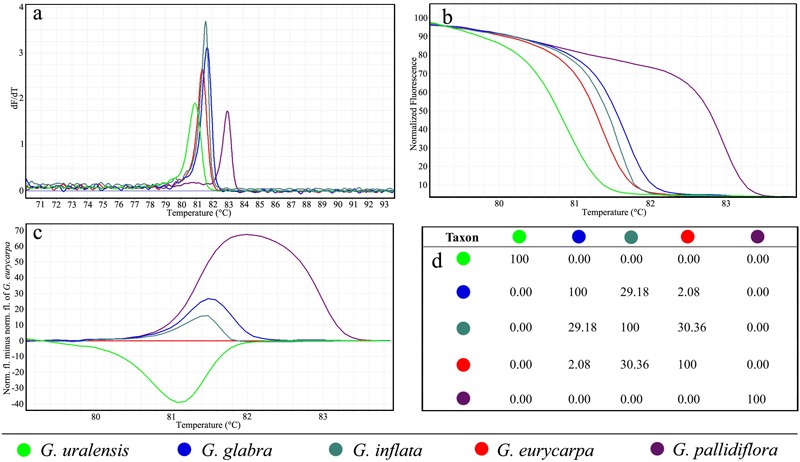
Microsatellite typing of five Glycyrrhiza species using HRM analysis with marker GM-S9. (a) Derivative melting curves. (b) Normalized melting curves. (c) Difference plot curves. (d) Average genotype confidence percentages.

Microsatellite typing of five Glycyrrhiza species using HRM analysis with marker GM-S9. (a) Derivative melting curves. (b) Normalized melting curves. (c) Difference plot curves. (d) Average genotype confidence percentages.