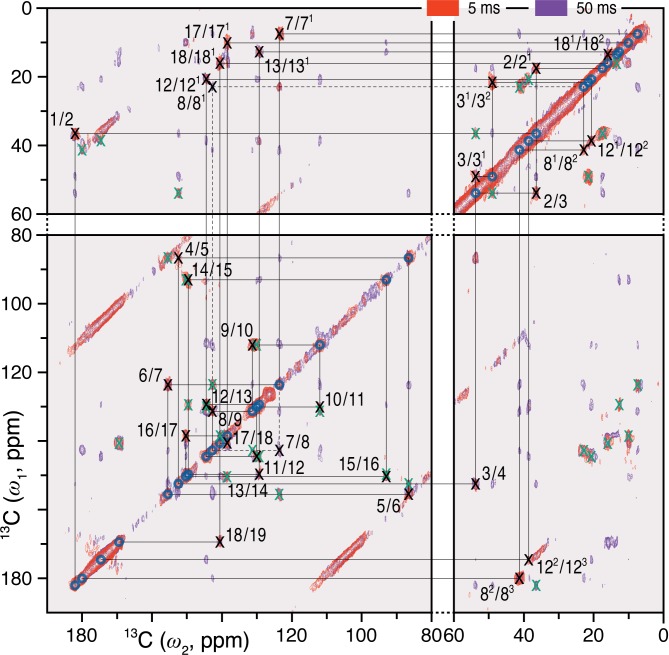
FIGURE 1.
2D 13C–13C DARR spectra of the oat phyA3 u-[13C,15N]-PCB chromophore as Pfr with 1H mixing times of 5 (red) and 50 (purple) ms. The cross-peaks assigned to the directly bonded chromophore carbons are marked × in black and numbered (for PCB chromophore numbering, see Figure 3). Corresponding off-diagonal counterparts are marked × in green. The cross-peaks that are not fully resolved using the mixing time of 5 ms are indicated by dashes. See also Supplementary Figure S1.

