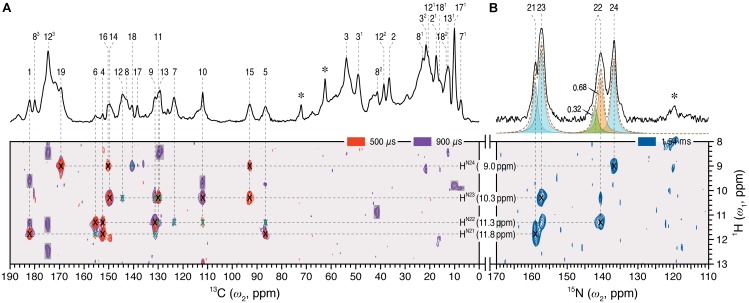
FIGURE 2.
2D 1H–13C MELODI–HETCOR and 1H–15N HETCOR spectra of the oat phyA3 u-[13C,15N]-PCB chromophore as Pfr. (A) The MELODI–HETCOR spectrum acquired with an LG–CP contact time of 500 μs (red) reveals mostly intramolecular 1H contacts of the chromophore carbons (for example, 1HN21 - N24–13CPCB, marked × in black). Heteronuclear signals obtained with a mixing period of 900 μs (purple) fall into two categories: (i) Intramolecular 1HN21 - N24–13CPCB correlations (marked × in black and green for fully and less resolved signals, respectively), and (ii) interfacial correlations between the chromophore and protein residues in its vicinity (shaded in gray). Intramolecular 1HN21 - N24–13CPCB correlations are summarized in Supplementary Table S2. (B) The 1H–15N HETCOR spectrum was acquired for tracing direct 1H–15N connectivities. For all three correlation spectra, only the characteristic spectral region of δH = 8–13 ppm (ω1-dimension) is shown. δH and δC/(δN) values are indicated by the horizontal and vertical lines, respectively. The 1D 13C and 15N MAS spectra of the same protein as Pfr are shown with assignments as the external projections along the ω2-dimension above the spectra in (A,B), respectively. Resonances marked with an asterisk indicate glycerol carbons and amide nitrogens of protein backbone originating from 13C and 15N in natural abundance.

