
Fig. 6. Effect of diabetes and cinnamic acid on AChE activity.
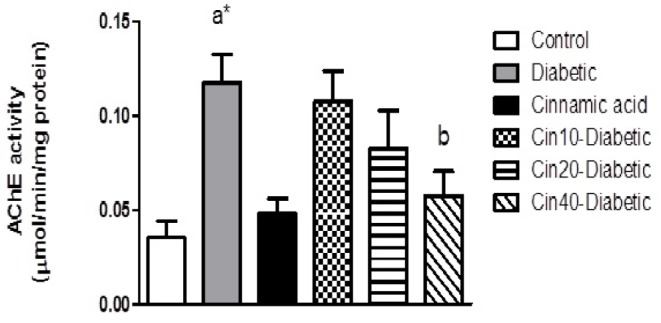
Data values are expressed as mean AChE activity (µmol/min/mg protein)±SEM. Letter a: indicates significant difference compared to control group (p<0.05). Letter b: indicates significant difference compared to diabetic group (p<0.05). a**: p<0.001. p values were from one-way ANOVA, followed by Tukey's test for multiple comparisons.