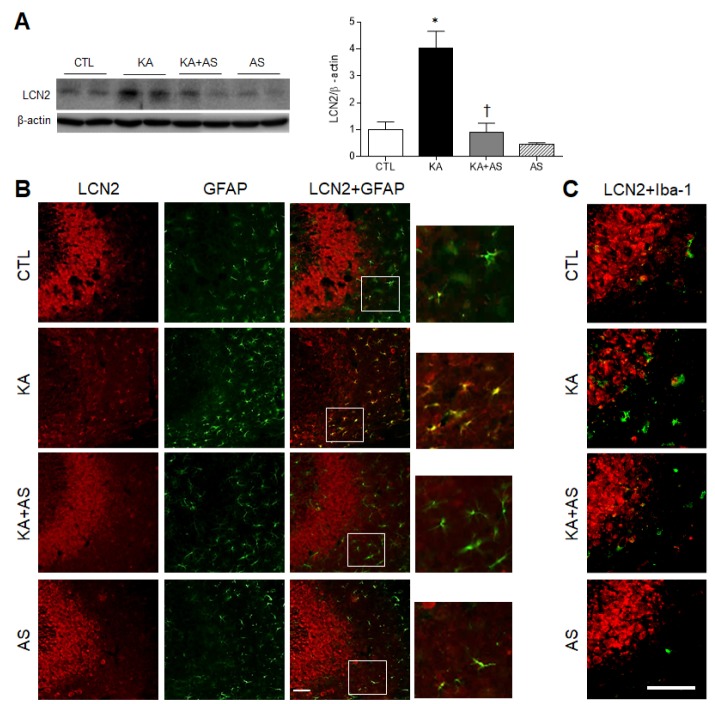
Fig. 3. Effect of atorvastatin pretreatment on LCN2 expression in KA-treated hippocampus.
(A) Western blots show hippocampal LCN2 expression 24 h after KA treatment. Densitometric values of LCN2 expression from three separate experiments (n=6–7 mice per group) were normalized to β-actin levels. *p<0.05 vs. CTL. †p<0.05 vs. KA. Representative images of double-immunofluorescence staining for LCN2 (red) and GFAP (green) (B) and LCN2 (red) and Iba-1 (green) (C) in the CA3 region of CTL, KA, KA+AS, and AS mice. Scale bar=50 µm.

