
Fig. 5. Effect of atorvastatin pretreatment on AKT phosphorylation in KA-treated hippocampus.
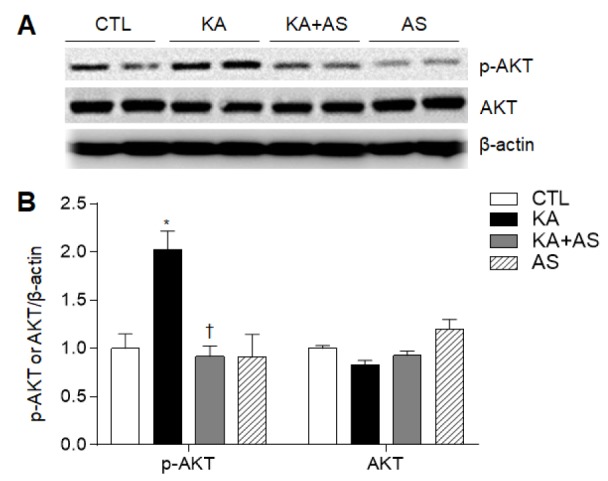
(A) Western blot shows p-AKT and AKT expression in KA-treated hippocampus. (B) Quantitative expression of p-AKT and AKT protein from the western blot analysis. Densitometric values of expression of each protein from three separate experiments (n=6–7 mice per group) were normalized to β-actin levels. Data are shown as mean±SEM. *p<0.05 vs. CTL. †p<0.05 vs. KA-treated mice.