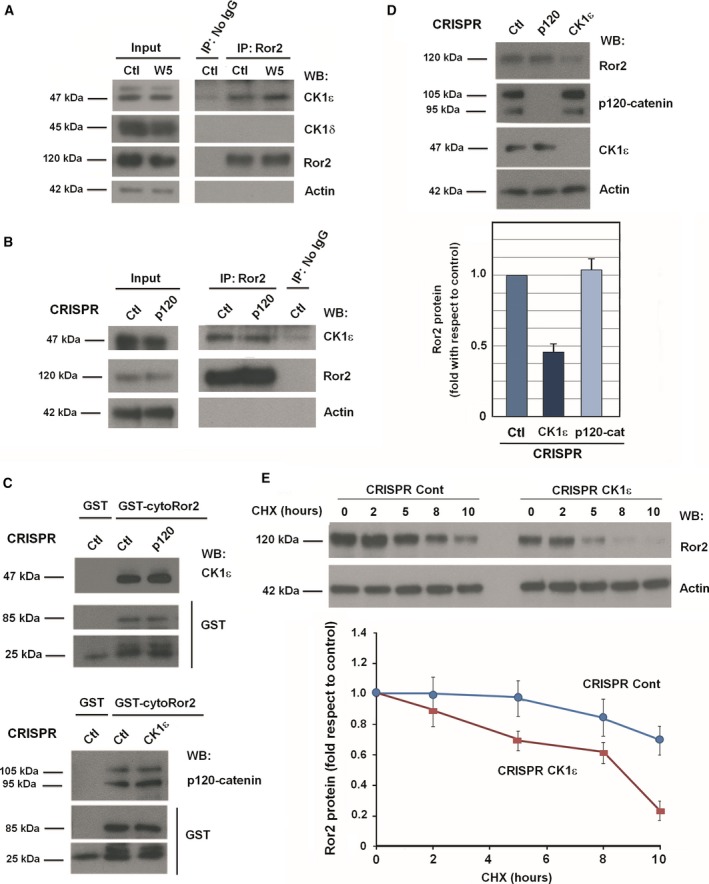
Figure 4.

CK1ε binds and stabilizes Ror2. (A, B) Control or p120‐catenin HEK293T CRISPR cells were treated with control or Wnt5a‐conditioned medium for 5 min, and Ror2 was immunoprecipitated from total cell extracts. Associated proteins were analyzed by WB. (C) Pull‐down assays were performed by incubating 700 μg total cell extracts from control, p120‐catenin, or CK1ε HEK293T CRISPR cells with 10 pmol of GST–cyto‐Ror2. Protein complexes were affinity purified and analyzed by WB. (D) Control, p120‐catenin, and CK1ε HEK293T CRISPR cells were lysed and analyzed by WB (top). Autoradiograms from three different experiments were quantified, and total Ror2 protein levels are shown (mean ± SD) (bottom). (E) Control or CK1ε HEK293T CRISPR were treated with 50 μg·mL −1 cycloheximide for the indicated times. Cells were lysed, and Ror2 protein levels were analyzed by WB (top). Autoradiograms from four different experiments performed were quantified using quantity one software (Bio‐Rad, Hercules, CA, USA) and represented for each time point with respect to the control (mean ± SD) (bottom).
