
Figure 1.
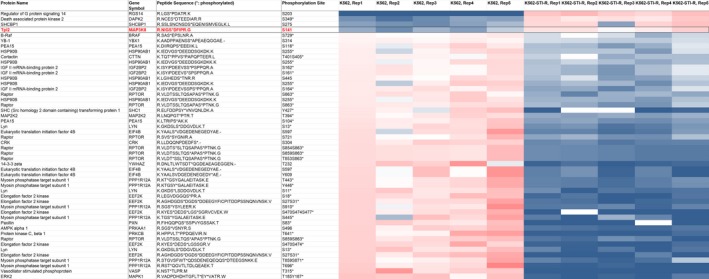
Heatmap representing abundance of phosphopeptides derived from MAPK‐ERK pathway‐specific core interactors. Abundance of phosphopeptides derived from 275 proteins listed in the MAPK‐Erk Pathway SuperPath was determined within the list of 2593 phosphopeptides displaying significant differences in IM‐sensitive K562 vs. IM‐resistant K562‐STI‐R cells. To select phosphopeptides that show statistically significant change in abundance between K562‐STI‐R and K562 cell lines, two‐tailed unpaired Student's t‐test and q‐values for multiple hypothesis tests were calculated based on the determined P‐values using the R package QVALUE. A heat map was generated by calculating a mean peak area for all samples showing statistical differences and then determining the ratio of individual peak areas to the means. Ratios range from 0.2 (blue) to 5 (red), 1 = white.