
Figure 5.
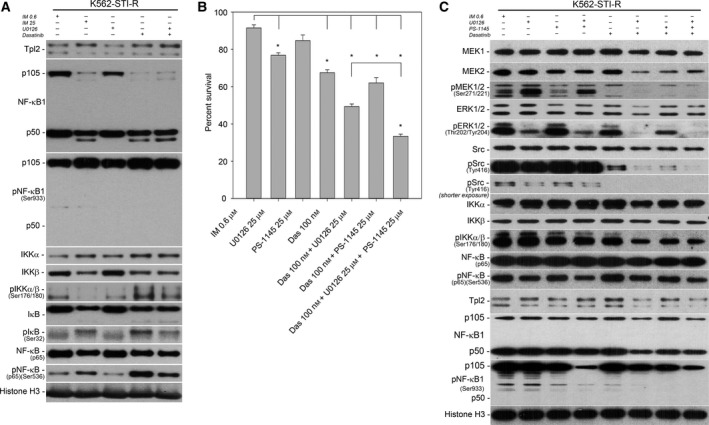
Sensitivity of IM‐resistant cells to SFK/MEK/IKK inhibition. (A) Western blot analysis was performed on K562 and K562‐STI‐R whole‐cell lysates. Protein levels and phosphorylation of NF‐κB pathway components (Tpl2, NF‐κB1 (p105, p50), IKK, IkB, and NF‐κB (p65)) were evaluated. Immunoblots representative of three independent experiments are shown. Histone H3 was used as a loading control. The densitometry results of the western blots along with statistical analyses are summarized in Fig. S6B. (B) FACS analysis of the percentage of Annexin V‐FITC‐positive (apoptotic) cells in a population of K562 and K562‐STI‐R cells incubated with 25 μm U0126, 25 μm PS‐1145, 100 nm dasatinib, the combination of 100 nm dasatinib and 25 μm U0126, the combination of 100 nm dasatinib and 25 μm PS‐1145, or the combination of 100 nm dasatinib, 25 μm U0126, and 25 μm PS‐1145. Data are shown as the mean and 1 SD for three independent analyses, *P < 0.05. (C) Protein levels and phosphorylation status of MEK1 and 2, ERK 1 and 2, SFKs, IKK, and NF‐κB (p65) in K562‐STI‐R cells incubated with 25 μm U0126, 25 μm PS‐1145, 100 nm dasatinib, the combination of 25 μm U0126 and 25 μm PS‐1145, the combination of 100 nm dasatinib and 25 μm U0126, the combination of 100 nm dasatinib and 25 μm PS‐1145, or the combination of 100 nm dasatinib, 25 μm PS‐1145 and 25 μm U0126. Representative immunoblots of three independent experiments are shown. The densitometry results of the western blots along with statistical analyses are summarized in Figs S3–S5.