Figure 3.

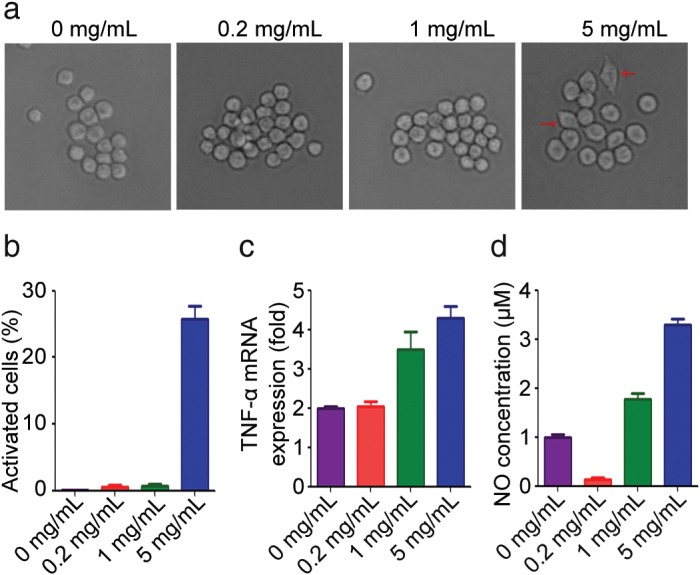
DSPS activates macrophages. (a) RAW264.7 cells were treated with various concentrations of DSPS for 24 hours, and the cellular morphology was analyzed with a phase‐contrast microscope. (b) Quantification of activated macrophages for experiments performed as described in (a). (c) Quantitative reverse transcriptase‐PCR analysis of the relative expression of TNF‐α messenger RNA (mRNA). (d) Quantification of nitric oxide (NO) production by RAW264.7 cells.
