
Figure 4.
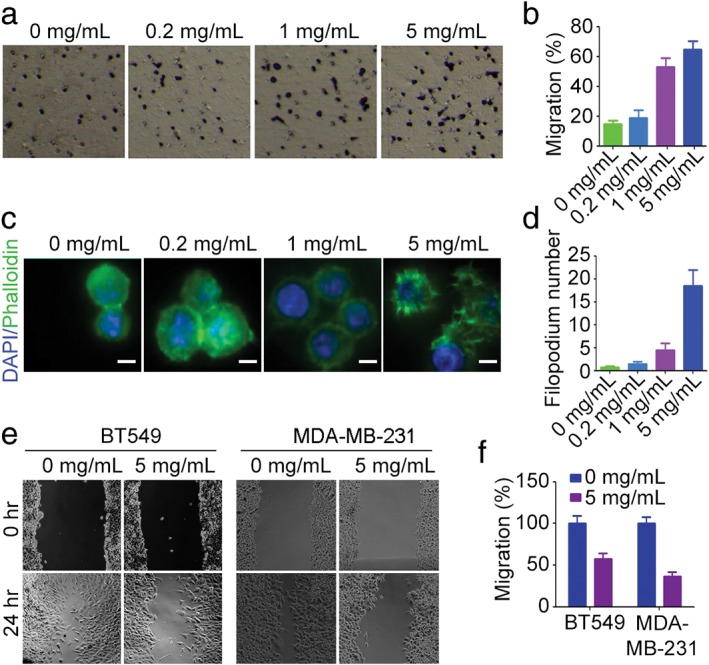
DSPS affects cell migration. (a) Transwell migration assay showing the effect of DSPS treatment on RAW264.7 cell migration. (b) Quantification of cell migration; cells were treated as in panel (a). (c) Immunofluorescence staining of actin (fluorescein isothiocyanate‐conjugated phalloidin) and nuclei (4′, 6‐diamidino‐2‐phenylindole) in RAW264.7 cells. Scale bars, 5 μm. (d) Quantification of filopodia presented in panel (c). (e) Representative wound healing assay analyzing the effects of DSPS on the migration of BT549 and MDA‐MB‐231 breast cancer cells. (f) Quantification of migrated cells treated as in panel (e).