Figure 5.

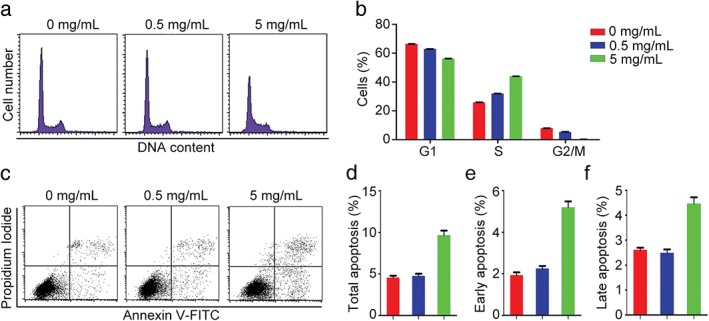
DSPS alters cell cycle progression and promotes apoptosis. (a) MDA‐MB‐231 cells treated with various concentrations of DSPS were stained with PI, and the cells were analyzed by flow cytometry to determine cell cycle progression. (b) Quantification of the percentage of cells in G1, S, and G2/M phases of cells treated as in panel A. 0 mg/mL, 0.5 mg/mL, 5 mg/mL. (c–f) MDA‐MB‐231 cells treated with various concentrations of DSPS and stained with Annexin V fluorescein isothiocyanate (FITC)/propidium iodide (c); the percentage of total apoptotic cells (d), cells in early apoptosis (e), and cells in late apoptosis (f) were quantified.
