
Figure 2.
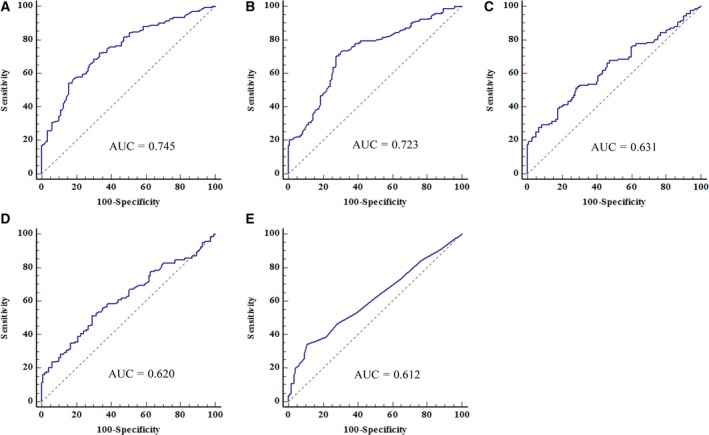
ROC analyses of SOX2OT, ANRIL, CEA, CYFRA21‐1, and SCCA during the training stage for diagnosis of NSCLC. The AUCs of SOX2OT (A) and ANRIL (B) were greater than those of CEA (C), CYFRA21‐1 (D), and SCCA (E), P < 0.05.
Official websites use .gov
A
.gov website belongs to an official
government organization in the United States.
Secure .gov websites use HTTPS
A lock (
) or https:// means you've safely
connected to the .gov website. Share sensitive
information only on official, secure websites.
ROC analyses of SOX2OT, ANRIL, CEA, CYFRA21‐1, and SCCA during the training stage for diagnosis of NSCLC. The AUCs of SOX2OT (A) and ANRIL (B) were greater than those of CEA (C), CYFRA21‐1 (D), and SCCA (E), P < 0.05.