FIGURE 4.

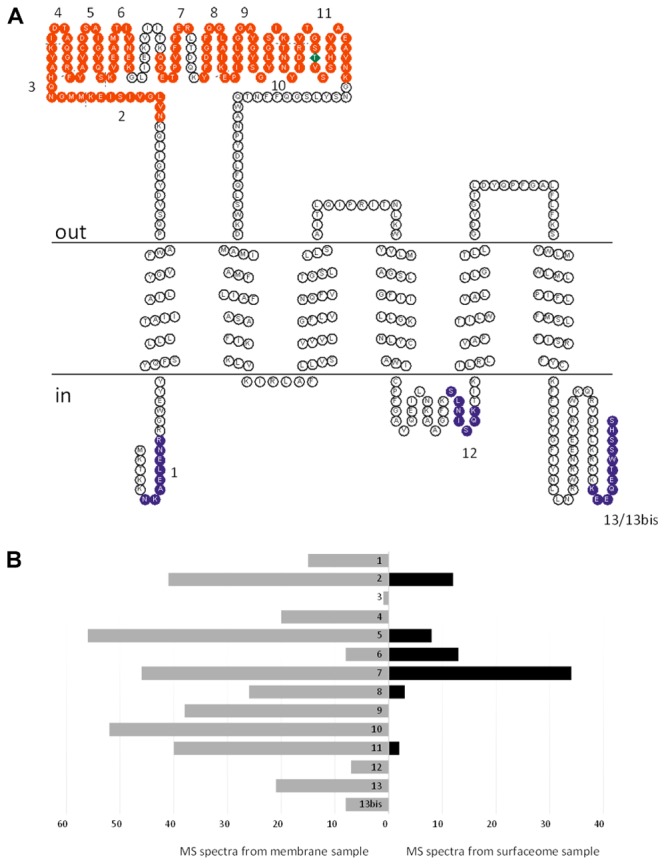
Topology analysis of D. restrictus PceC from shaving experiment. (A) The predicted topology of PceC is shown. In red are indicated the peptides detected at the surface of D. restrictus cells, while in purple the ones exclusively detected in the membrane sample. (B) Graphical view of the number of detected peptides in the membrane sample (in gray) and in the surfaceome (in black).
