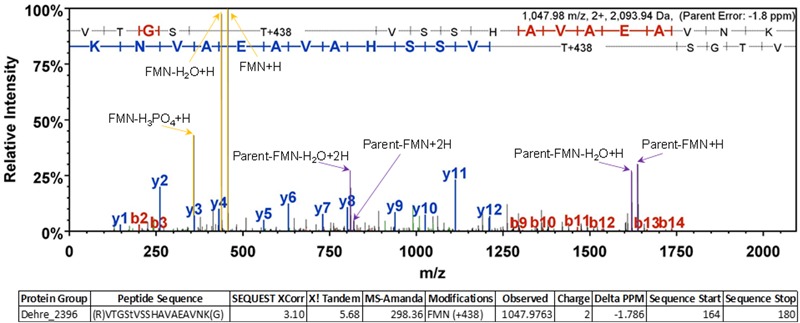
FIGURE 5.

Representative MS/MS spectrum confirming the FMN localization at position T168 of PceC. Diagnostic ions corresponding to the FMN+H and its fragments are highlighted in yellow allowing unambiguous identification of the post-translational modification.
