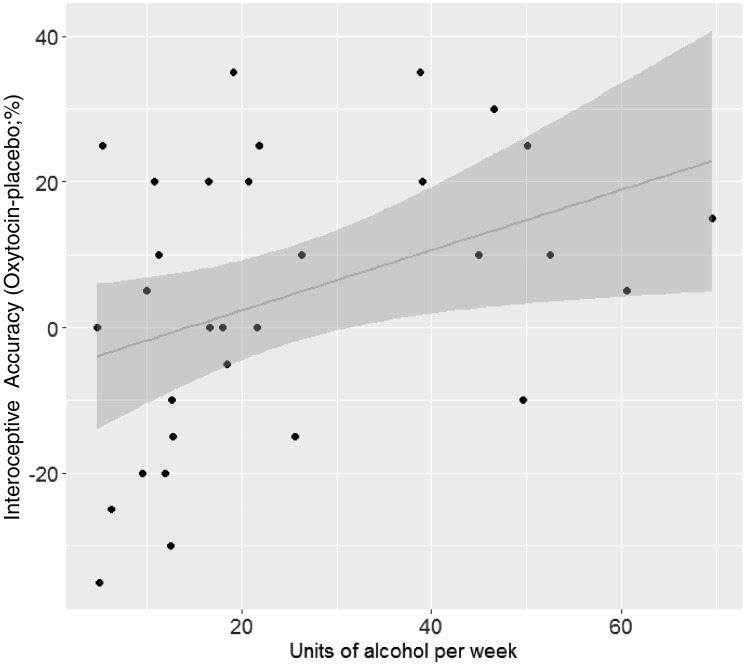
Fig. 1.
Scatterplot illustrating the interaction between Drug (OT/Placebo) and alcohol units per week on interoceptive accuracy during the heartbeat discrimination task. The y-axis is displaying the difference between interoceptive accuracy under OT and under placebo, in percentage. The shaded area represents the SE.

