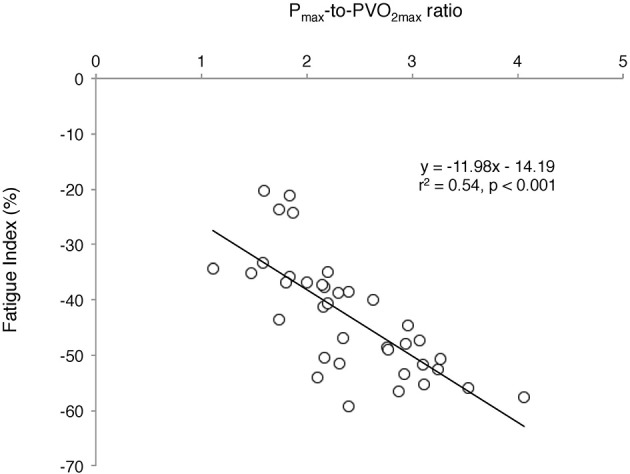
Figure 5.

Relationship between the fatigue index (FI, i.e., the relative decrement in power output over the Wingate test) and the maximum anaerobic-to-aerobic mechanical power ratio (Pmax-to-PVO2max) considering all participants. The higher the relative anaerobic contribution, the higher the development of fatigue during the Wingate test.
