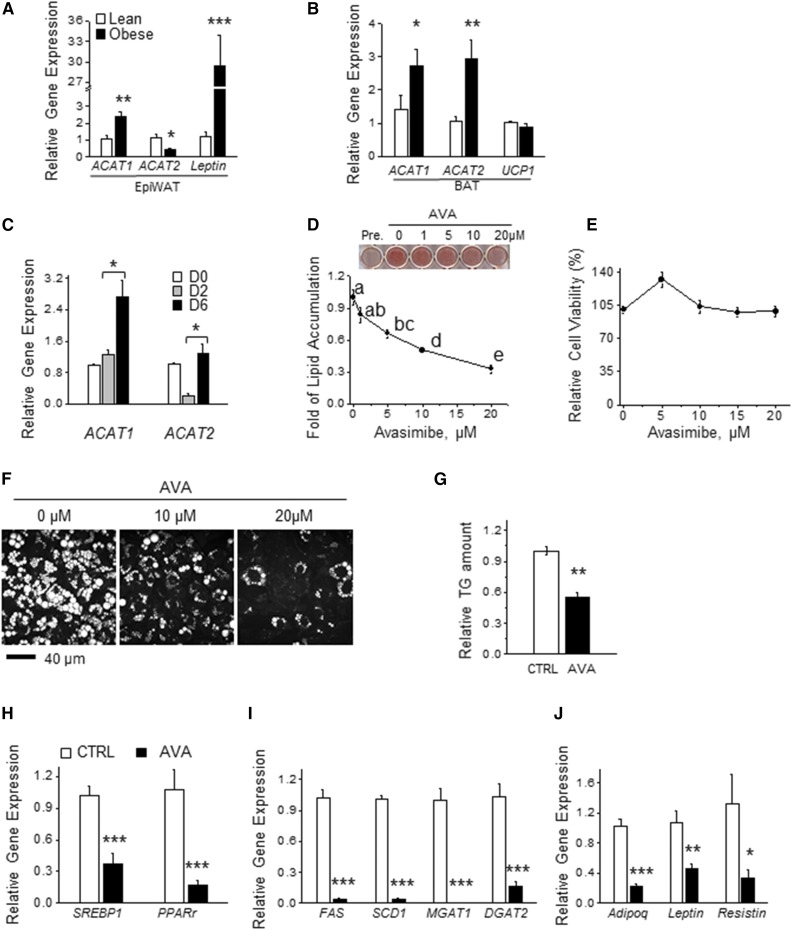
Fig. 1.
Inhibiting ACATs suppresses lipid accumulation in adipocytes during adipogenesis. A, B: mRNA levels of ACAT1 and ACAT2 determined by real-time PCR in epiWAT (A) and BAT (B) from chow diet-fed mice and age-matched DIO mice (male, 13 weeks old, C57BL/6J, Jackson Laboratory). Signals were normalized to RPL27 (n = 4). C: mRNA levels of ACAT1 and ACAT2 in 3T3-L1 cells during adipogenesis as determined by real-time PCR and normalized to β-actin (n = 3, repeated three times). D: ORO staining from adipocytes (day 6) that were differentiated with or without AVA at various concentrations (1–20 μM) for 6 days (n = 3). E: Adipocyte viability upon AVA treatment (0–20 μM) for 48 h was determined by MTT assay (n = 3). F: CARS image analysis of intracellular LDs in adipocytes that were differentiated in the presence or absence of AVA (10 or 20 μM) for 9 days (n = 3). G: Mature adipocytes differentiated with or without AVA (20 μM) during days 4–8 were subjected to TLC. The intensity of the TG spots in TLC was quantified by ImageJ and normalized to control (CTRL) (n = 3). mRNA levels of genes involved in adipogenic transcription program (H), lipid synthesis (I), and adipokine production (J) were determined by real-time PCR with signals normalized β-actin (n = 3). All the data were normalized to control. Data presented are expressed as mean ± SEM. Student’s two-tailed t-test was applied to A–C and G–J. *P < 0.05; **P < 0.01; ***P < 0.001. One-way ANOVA with Bonferroni post hoc test was applied in D and E, and different lowercase letters indicate significant different (P < 0.05).

