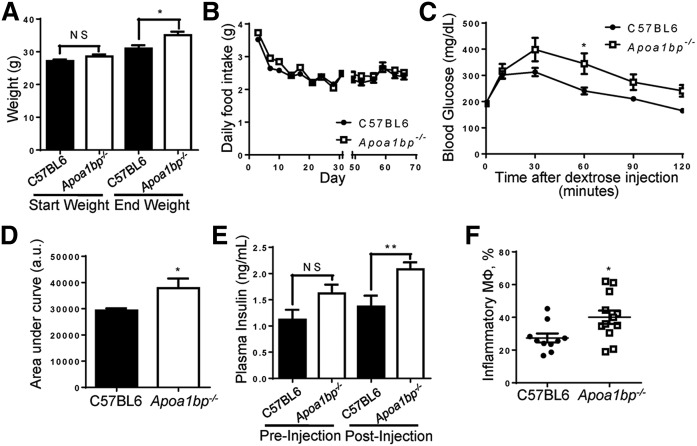
Fig. 1.
Mice lacking AIBP exhibit metabolic abnormalities. C57BL/6 and Apoa1bp−/− mice were fed a HFD containing 45% (kcal) fat for 10 weeks starting at age 10 weeks. A: Mice were weighed at the start and completion of the diet (Student’s t-test). B: Food intake was measured twice a week for the duration of the 10 week feeding period, with an interruption (X-scale break) while mice were moved and housed for metabolic testing. Prior to metabolic testing, mice were group-housed, and measurements given are based upon cage averages. No error bars are shown during the period for this reason. Following metabolic testing, all animals were individually housed, and measurements given represent the average of all individual mice. Error bars are only shown for the singly housed time period and are SEM. C: Glucose tolerance test. At week 8 of HFD feeding, mice were injected with dextrose solution, and blood was collected at time points shown (two-way ANOVA with Bonferroni’s post hoc test). D: Integrated glucose levels (area under the curve from C; Student’s t-test). a.u., arbitrary units. E: Insulin levels during glucose tolerance test at times 0 and 10 min (Student’s t-test). F: Upon euthanization at 10 weeks of feeding, WAT was harvested from mice. Cells in the isolated stromal vascular fraction were characterized by FACS analysis. Inflammatory macrophages were defined as F4/80+CD11b+CD11c+ (Student’s t-test). Mean ± SEM; n = 10–12; ** P < 0.01; * P < 0.05; NS, not significant differences.

