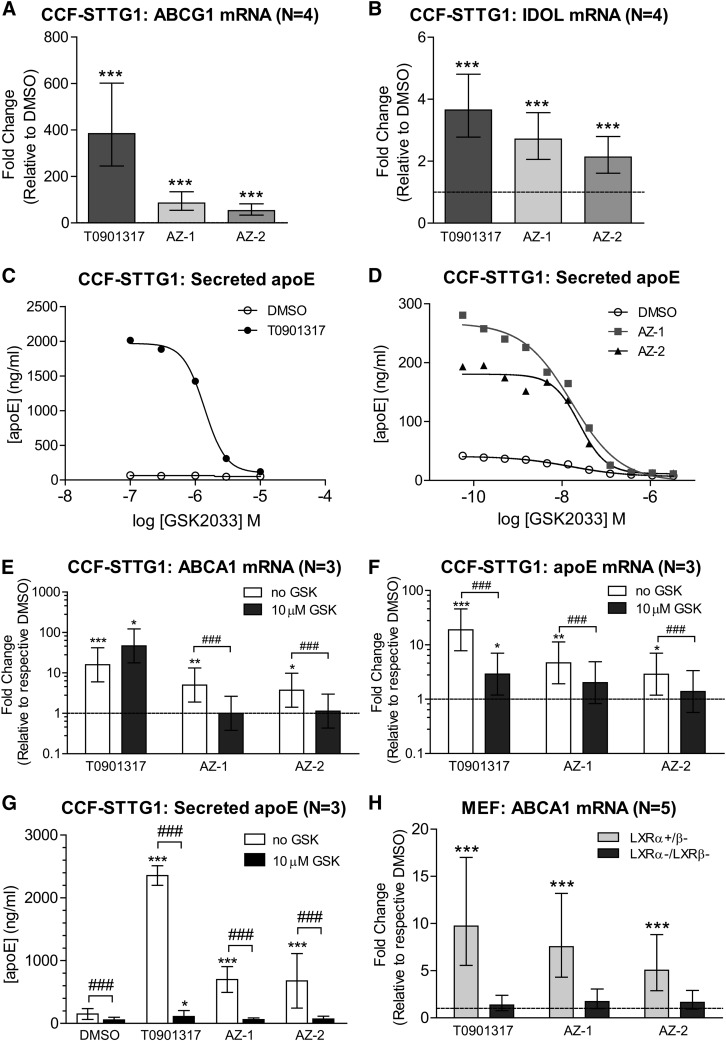
Fig. 4.
AZ-1 and AZ-2 activate endogenous LXR signaling. ABCG1 (A) and IDOL (B) mRNA levels were measured by real-time qPCR in CCF-STTG1 cells after 72 h treatment with vehicle control DMSO, 1 μM T0901317, or 10 μM AZ-1 or AZ-2. Graphs represent fold-change over DMSO control (dashed line) and ±95% confidence intervals from four independent experiments. ***P < 0.001 compared with vehicle control using blocked two-way ANOVA post hoc tests. C: Log dose response curves for a known LXR antagonist, GSK2033 (0.1–10 μM), on apoE secretion by CCF-STTG1 in cotreatment with DMSO or 1 μM T0901317 for 72 h. D: Log dose response curves for GSK2033 (0.05 nM to 30 μM) on apoE secretion in cotreatment with DMSO or 10 μM AZ-1 or AZ-2 for 72 h. ABCA1 mRNA (E), apoE mRNA (F), and media apoE (G) levels were measured following 72 h treatment of 1 μM T0901317 or 10 μM AZ-1 or AZ-2 without or with 10 μM GSK2033 (GSK). Graphs are presented either as fold-change over respective DMSO control (dashed line) and ±95% confidence interval for C and D, or as mean concentration and SD for G from three experiments. *P < 0.05, **P < 0.01, ***P < 0.001 comparing drug effect over respective DMSO control; ###P < 0.001 comparing between no GSK2033 versus GSK2033 inhibition within each drug condition by blocked three-way ANOVA post hoc tests. H: LXR-knockout (LXRα−/β−) and LXRα-expressing (LXRα+/β−) MEF cells were treated with DMSO or drugs for 48 h. ABCA1 mRNA levels were measured by real-time qPCR. The graph represents fold-change over respective DMSO control (dashed line) ±95% confidence interval from five experiments.

