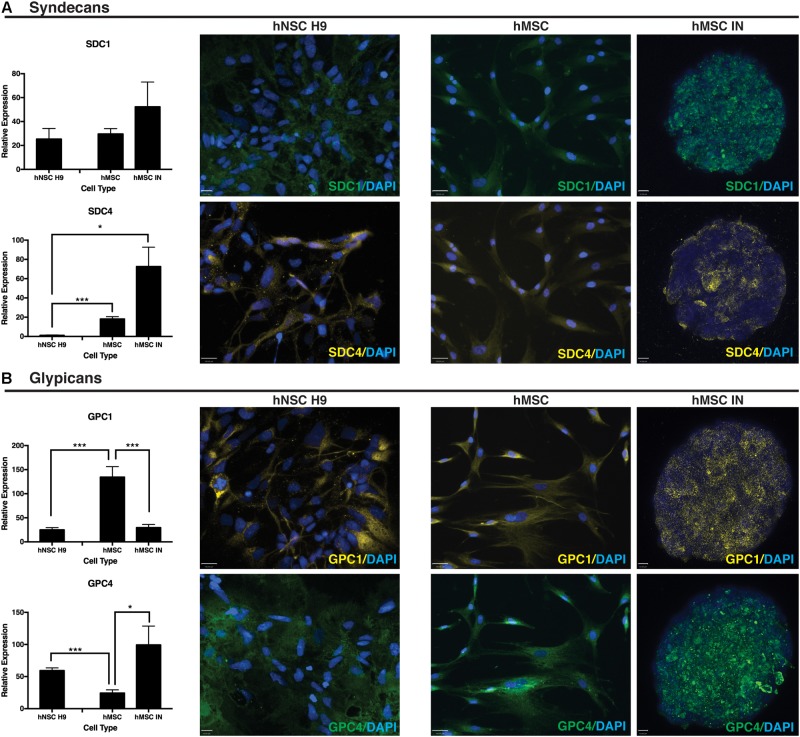
FIGURE 5.
Heparin sulfate proteoglycan (HSPG) core proteins. (A) Syndecans. Representative immunocytochemistry (ICC) images from undifferentiated primary and induced cultures demonstrate no detectible visual difference in levels of syndecan 1 (SDC1) between culture conditions. This observation is supported by the corresponding Q-PCR data. Gene expression levels of syndecan 4 (SDC4) were significantly higher in hMSC IN compared to undifferentiated hMSCs and hNSC H9 cultures. Scale bars represent: hNSC H9 SDC1 70 μm, SDC4 100 μm; hMSC 100 μm; hMSC IN 16 μm. (B) Glypicans. Gene expression levels of glypican 1 (GPC1) were significantly higher in undifferentiated hMSC cultures than hNSC H9 and hMSC IN cultures. Similar levels of GPC1 were detected in the primary hNSC H9 cultures compared to hMSC IN. In contrast, significantly higher gene expression of glypican 4 (GPC4) was detected in the neural cultures (hNSC H9 and hMSC IN) when compared to undifferentiated hMSCs. ICC staining with primary antibodies specific to HSPG core proteins demonstrated visible differences between culture conditions, with this observation supported by Q-PCR results. Secondary antibodies: FITC (green) and Cy3 (yellow). Cultures counterstained with DAPI to reveal nuclei. Scale bars represent: hNSC H9 GPC1 100 μm, GPC4 70 μm; hMSC 100 μm; hMSC IN 10 μm. ∗p < 0.05, ∗∗∗p < 0.0001.

