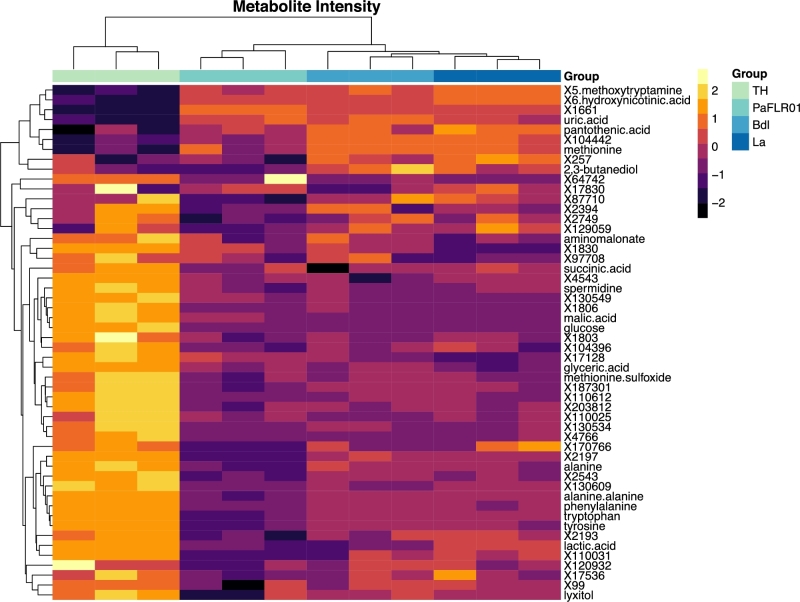
Figure 3.
Heatmap of important metabolites chosen based on the randomForest algorithm. The top 50 metabolites output from the randomForest algorithm with the addition of glucose and 2,3-butanediol are presented. Metabolites were normalized by a log2 and scale transformation in R. The legend represents the z-scores, standard deviation from the mean, of the log2 transformed data. TH = Todd Hewitt media blank. La = PaFLR01 + 20 mM lactic acid. Bdl = PaFLR01 + 20 mM 2,3-butanediol. The metabolites labeled with an X and number are unannotated, although the ion can be consistently identified across samples. Dendrograms are hierarchically clustered based on Euclidean distances.

