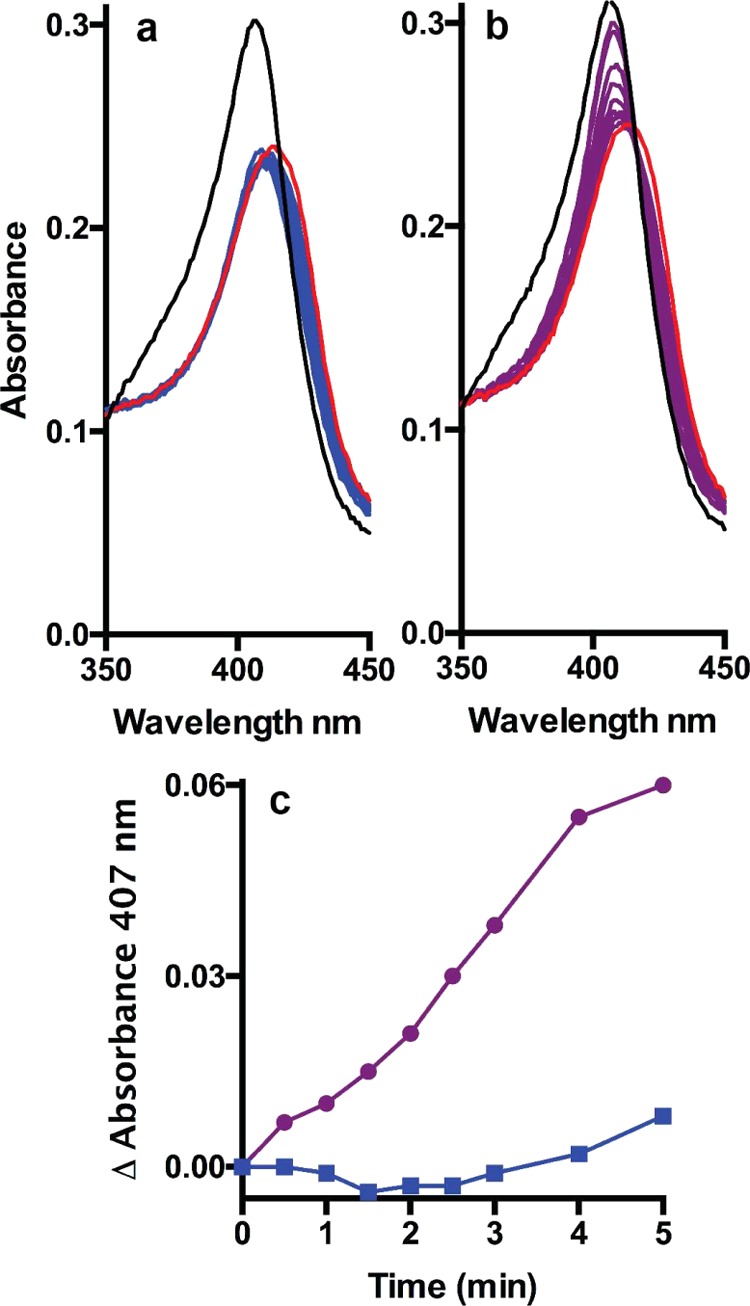
Figure 2.

Reduction of compound I* ferryl intermediate mixture of KatG by kanamycin. (a, b) Resting-state spectrum (3.1 μM) is shown in black, and the spectrum of the oxoferryl species after 1 min reaction with a 10× excess of peracetic acid is shown in red. The mixtures were then incubated at 20 °C without (a) and with (b) a 100× excess of kanamycin, and spectra were collected at 0.5, 1, 1.5, 2, 2.5, 3, 4, and 5 min (blue in (a) and purple in (b)). (c) Changes in absorbance at 407 nm from the spectra in (a) (blue) and (b) (purple).
