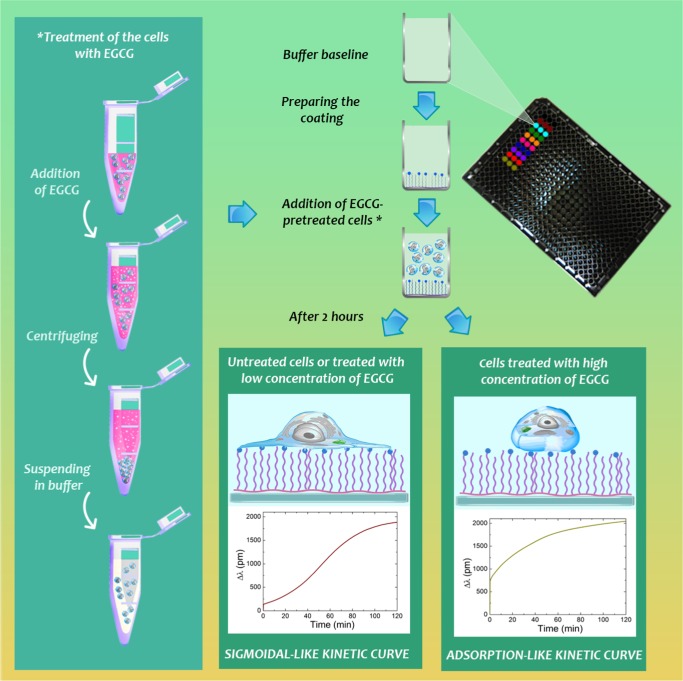
Figure 2.
Summarized schematic illustration of the label-free method employing the Epic BT biosensor. Cells were pre-exposed to various concentrations of EGCG and then transferred to the biosensor wells to record their adhesion and spreading on the RGD displaying polymer surfaces. As the most striking observation, cell spreading with low concentration of EGCG or without EGCG shows sigmoidal-like kinetic curves (active, living process), whereas treatments with high concentration of EGCG result in adsorption-like kinetic curves (dead process).

