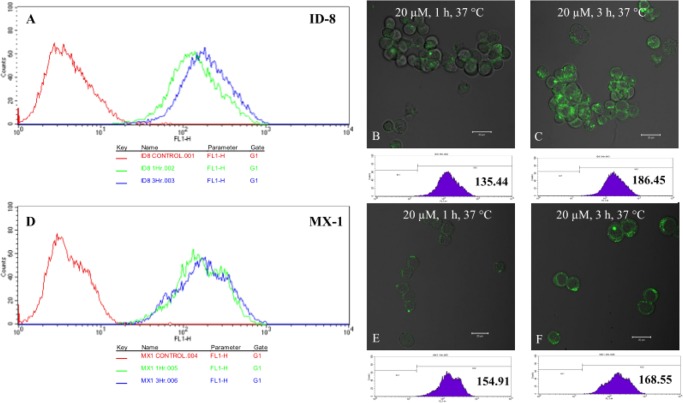
Figure 5.
CFM images and flow cytometry analysis of different types of cells after incubation with 3 at the final concentration of 20 μM at 37 °C for different periods. (A) Flow cytometry analysis of 3 in ID-8 at 0 h (red, control), 1 h (green), and 3 h (blue). (B, C) CFM images and flow cytometry analysis in ID8 at 1 and 3 h, respectively. (D) Flow cytometry analysis of 3 in MX-1 at 0 h (red, control), 1 h (green), and 3 h (blue). (E, F) CFM images and flow cytometry analysis in MX-1 at 1 and 3 h, respectively. (For full internalization study results using ID8 and MX-1 cancer cells, as well as WI-38 normal human lung fibroblast cells, see Figure S49 in the Supporting Information.).

