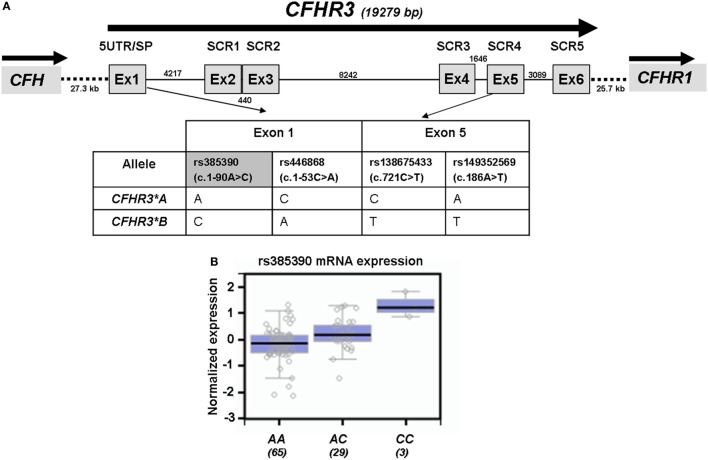
Figure 1.
Genetic variants associated with the CFHR3*A and CFHR3*B alleles. (A) Exon–intron structure of the CFHR3 gene showing the location of the genetic variants within exon 1 (rs385390; rs446868) and exon 5 (rs138675433; rs149352569) that tag the CFHR3*A and CFHR3*B alleles. (B) In silico data of gene expression correlations from the GTExPortal show that individuals who are homozygous for the rs385390 A variant present lower mRNA expression in liver tissue than individuals homozygous for the rs385390 C variant, or than heterozygous individuals. Number of individuals with each genotype is shown between brackets. GTExPortal: Portal for the Genotype-Tissue Expression project (https://www.gtexportal.org). GTExPortal is supported by the Common Fund of the National Institutes of Health. The data in panel (B) were obtained on October 2017.

