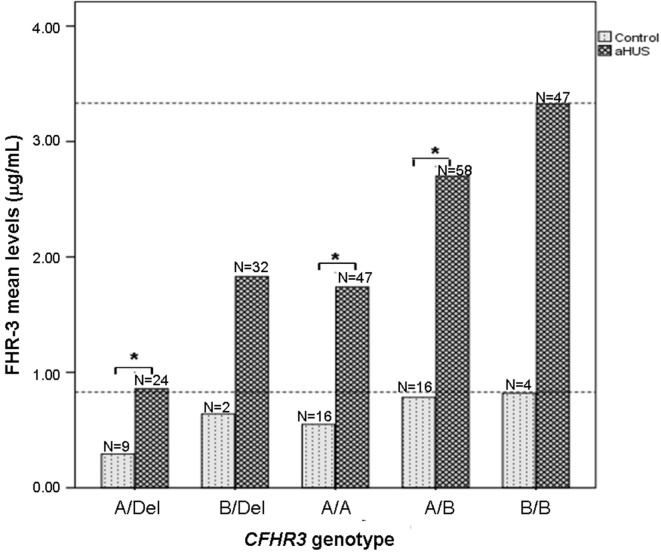
Figure 3.
FHR-3 levels are higher in patients with atypical hemolytic uremic syndrome (aHUS) than in controls. Histogram showing the mean FHR-3 levels in controls and in patients with aHUS with different CFHR3 genotypes. Statistically significant differences (Kruskal–Wallis test, p < 0.05) are denoted by an asterisk. Dashed lines indicate the highest FHR-3 level observed in controls and patients.

