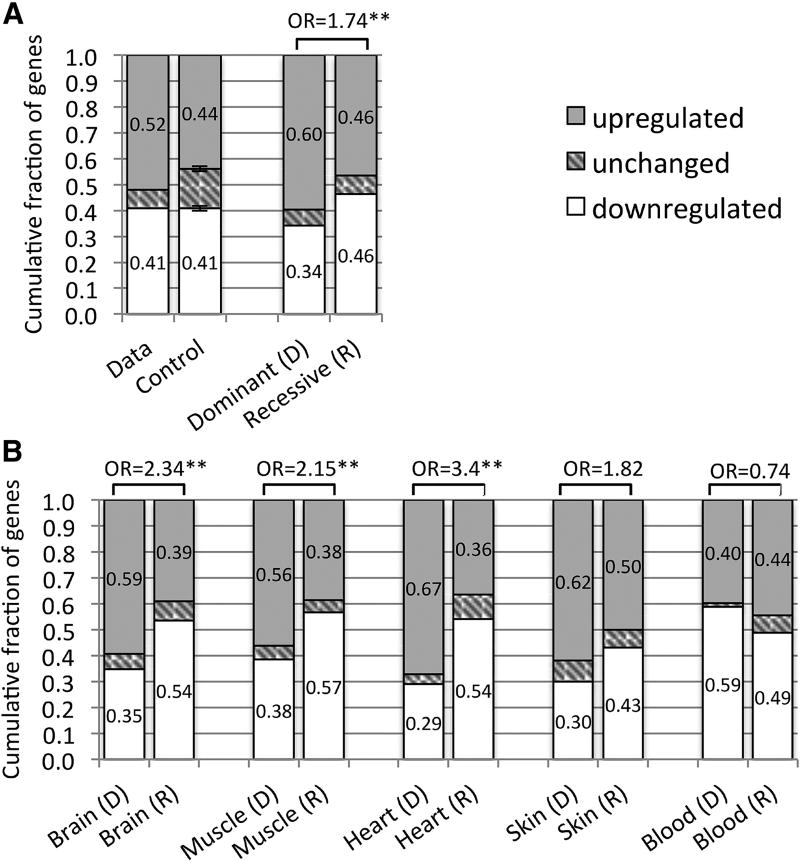
Figure 2. Up and down regulated genes in affected versus unaffected tissues.
(A) Fractions of up and down regulated disease genes in affected tissues compared to unaffected tissues are shown for our data and for a random control model, including disease genes affecting up to 3 tissues (n=1,823, left bars). These fractions are also shown for subsets of genes associated with autosomal dominant (n=461) and autosomal recessive (n=743) disorders (right bars). (B) Comparing up and down regulation of genes associated with autosomal dominant (D) and autosomal recessive (R) disorders across different tissues. In these analyses up and down regulation were determined by dividing 6,665 GTEx samples into those from affected and unaffected tissues and comparing their expression using a Wilcoxon rank sum test. Fractions of genes in each group are inscribed in the bars (rounded to 2 decimal points). Odds ratios (OR) comparing up and down regulated genes in dominant and recessive disorders are indicated (“*” and “**” correspond to p-values < 0.01 and < 0.001 respectively).

