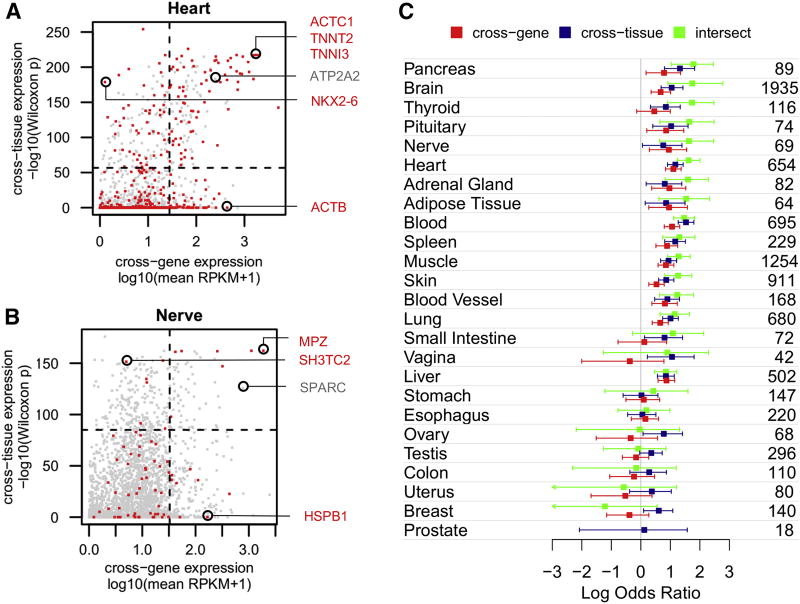
Figure 3. Cross-gene and cross-tissue expression.
Cross-gene and cross-tissue expression measures are plotted for 2,747 disease genes in heart (A) and nervous tissue (B). Genes associated with phenotypes affecting each tissue are colored red; other disease genes are colored grey. Cross-gene expression corresponds to mean expression of all GTEx samples from one tissue. Cross-tissue expression corresponds to the –log10(p-value) derived from a Wilcoxon rank sum test comparing expression of a gene in one tissue with its expression in all other tissues (computed to identify elevated expression – see Methods). Circled genes are discussed in the text. Horizontal and vertical dashed lines mark the top 10% value on each axis, dividing the plot into quadrants. (C) Odds ratios representing enrichment of genes associated with phenotypes in each tissue versus those that are not, are computed using the top 10% of genes on the cross-gene axis (colored red), cross-tissue axis (colored dark blue) and their intersect (colored green). The numbers of genes associated with a phenotype in each tissue are shown on the right.

