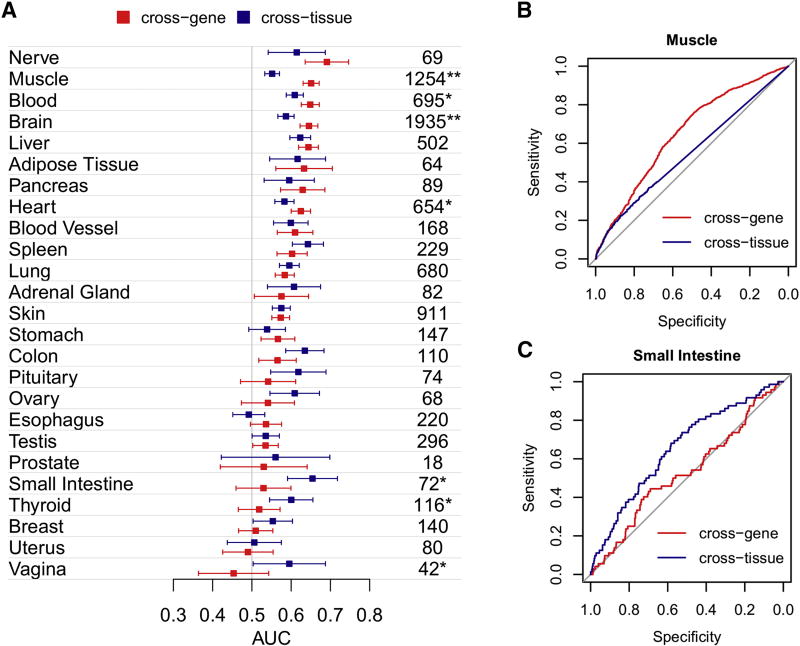
Figure 4. Linking expression and phenotype.
(A) AUCs quantifying the strength of expression-phenotype relationships are shown for each tissue with 95% confidence intervals based on cross-gene (colored red) and cross-tissue (colored dark blue) expression measures. Numbers of genes associated with a phenotype in each tissue are shown on the right. Significant differences between cross-gene and cross-tissue measures are indicated with an asterisk (“*” and “**” correspond to p-values < 0.01 and < 0.001 respectively). ROC curves for Muscle (B) and Small Intestine (C) demonstrate differences between cross-gene and cross-tissue measures.

