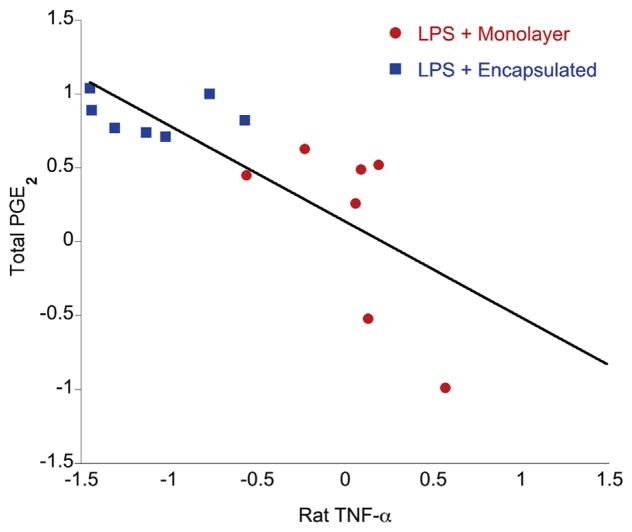
Figure 3.
Correlation between total PGE2 and rat TNF-α measured in OHSC culture supernatants for MSC treatment conditions (1 × 10⁵ MSCs/well). Linear regression and Pearson’s co-efficient (r) were derived from z-scores of standardized data. There is a significant (P = 0.0008) negative correlation—increasing PGE2 correlates with decreasing TNF-α—and a clear grouping of treatment conditions: encapsulated MSC treatment clusters at high levels of PGE2 and low levels of TNF-α, and monolayer MSC treatment clusters at low levels of PGE2 and higher TNF-α.

