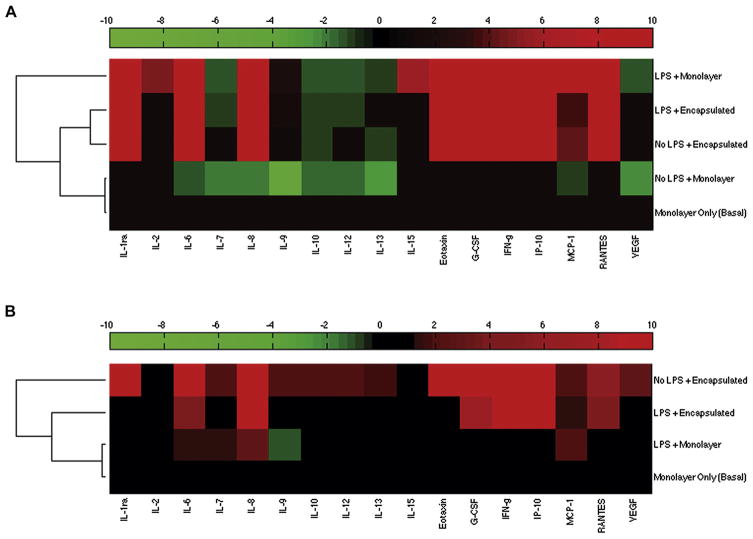
Figure 8.
Heat-map representation of hierarchical cluster analysis on secretome data of (A) MSC treatment conditions (+OHSC, ±LPS) normalized to baseline monolayer MSC-only condition (no LPS, no co-culture) and (B) monolayer (+LPS) and encapsulated MSC (±LPS) culture alone normalized to baseline monolayer MSC only condition (no LPS). For all conditions, 1 × 10⁵ MSCs/well were used. Increased levels of secretion are represented in shades of red and decreased levels in shades of green.

