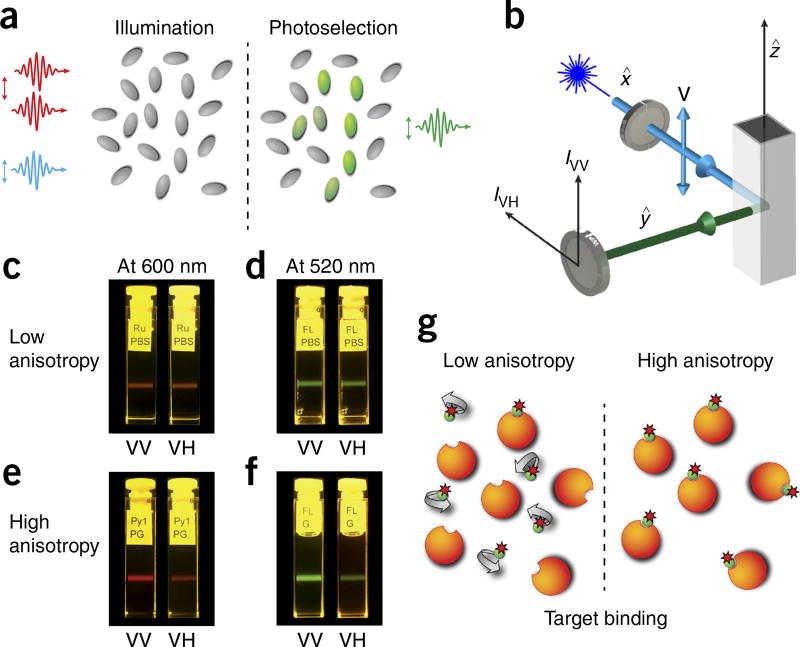
Figure 1.
Fluorescence anisotropy principles and measurements. (a) Polarized light selectively excites fluorophores aligned along a preferential axis. If the rotation of the molecule occurs on a time scale that is shorter than its fluorescence lifetime, the fluorescence emission will present a certain degree of anisotropy. (b) Standard configuration for fluorescence anisotropy measurements. A sample is excited with vertically polarized light (IV). The intensity of the emitted fluorescence is analyzed through a polarizer oriented parallel (IVV) and perpendicular (IVH) to the incident excitation vector field. x̂, ŷ, ẑ indicate the unit vectors. (c–f) Images of fluorescence anisotropy for different dyes presenting low and high anisotropy. (c) RU PBS (ruthenium tris(bipyridyl) [Ru(bipy)3] in PBS). (d) FL PBS (fluorescein in PBS). (e) Py1 PG (pyridine 1 in propylene glycol). (f) FL G (fluorescein in glycerol). (g) Upon binding to their target, fluorescently labeled small-molecule drugs increase their fluorescence anisotropy value.

