Figure 11.
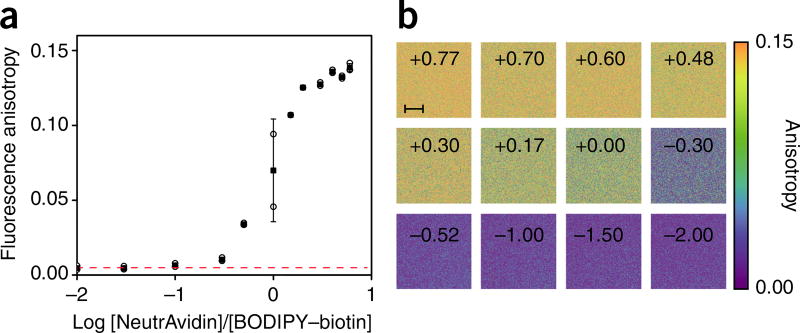
Fluorescence anisotropy measurements for receptor/binding quantification. (a) Fluorescence anisotropy of a 15 µM solution of BODIPY–biotin titrated against NeutrAvidin. The anisotropy of the free and bound states is determined by the top and bottom part of the semi-log binding isotherm. Owing to the fluorescence anisotropy additive property (equation 4), the measurements can be directly converted to the fraction-weighted sum of the two possible states (bound versus free BODIPY–biotin). Individual measurements (open circles), averages (black squares), and standard deviations of the means (bars) are indicated. Red dashed line indicates the fluorescence anisotropy value for free BODIPY–biotin. N = 3.
(b) Fluorescence anisotropy images of the stock solutions at different titration points (indicated in black in the boxes). Images are color-mapped using a perceptually balanced color scheme for better visualization across the entire anisotropy range. Scale bar, 10 µm.

