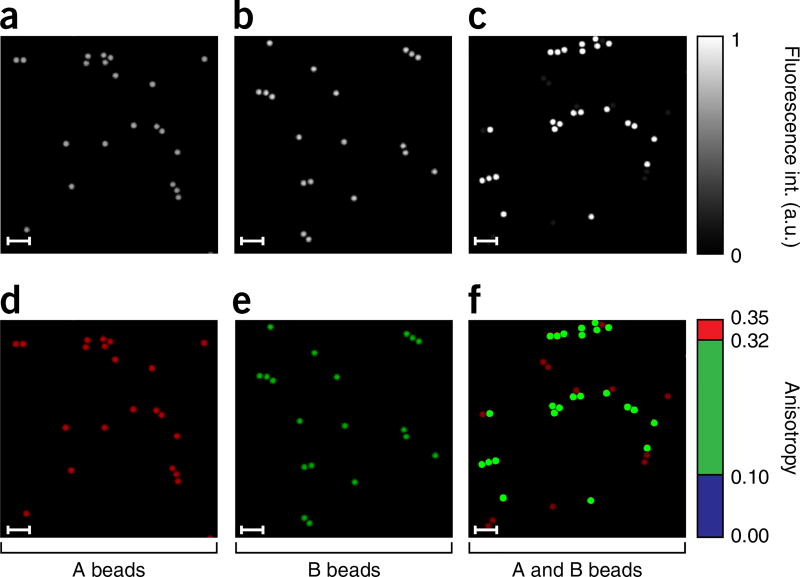
Figure 12.
Imaging phantom for fluorescence anisotropy imaging. (a–f) Fluorescence intensity (a–c) and fluorescence anisotropy (d–f) images of two separate (a,b,d,e) and mixed (c,f) bead populations with different relative intensity concentrations. At a high fluorophore concentration (B beads), homo-FRET takes place, reducing the effective value of fluorescence anisotropy69. The two bead populations can then be resolved on the basis of their fluorescence anisotropy values. Scale bars, 17 µm.

