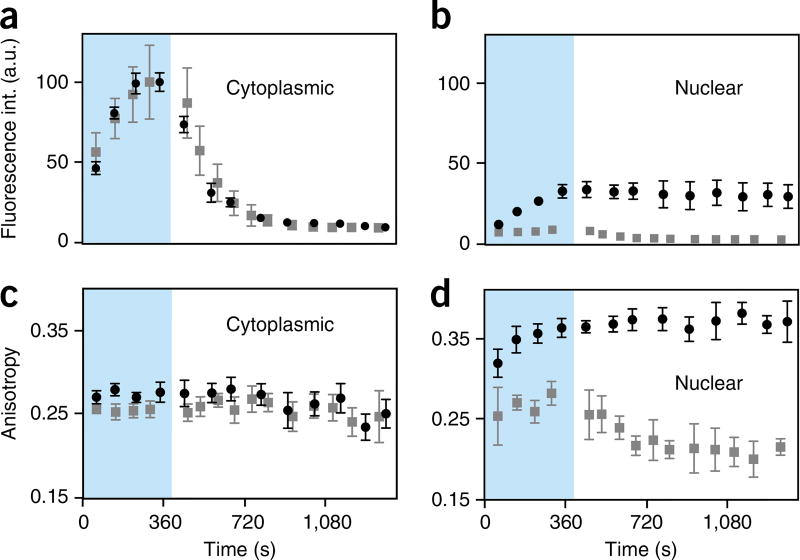
Figure 15.
Two-photon fluorescence anisotropy imaging of drug-target engagement. (a–d) Quantification of fluorescence (a,b) and anisotropy (c,d) signal in HT1080 cells during incubation time in fluorescently labeled olaparib (blue box) and following washing, in the cytoplasmic and nuclear cellular compartments. Black circles and gray squares represent values obtained in the absence and presence, respectively, of a five-fold-higher concentration of unlabeled small-molecule olaparib (AZD2281). Points on the graphs refer to a single experiment, average±s.d.; average calculated over n = 6 cells. Adapted with permission from Dubach et al.4, Nature Publishing Group.

