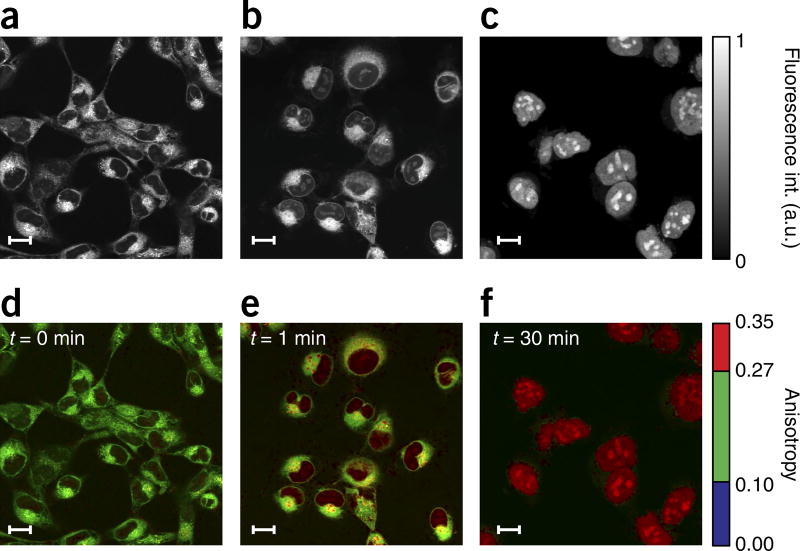
Figure 3.
Results from HT1080 cells incubated in PARPi-FL. Fluorescence intensity (a–c) and weighted fluorescence anisotropy images (d–f) for HT1080 cells incubated in PARPi-FL (1 µM) for 1 min. (a,d) HT1080 cells incubated for 1 min in PARPi-FL with no washing. (b,e) 1 min after washing. (c,f) 30 min after washing. Following washing, the cytoplasmic PARPi-FL is cleared, whereas the nuclear, bound drug remains present. Because PARP1 is a relatively large molecule (~120 kDa), a considerable change in fluorescence anisotropy is present between the free and the target-bound PARPi-FL (Fig. 1g). Two-photon fluorescence anisotropy microscopy allows the quantification of the exact fraction of drug bound to its target in the cell. In the images, an anisotropy threshold is assigned to distinguish among the different states (bound/unbound) of the drug. When the cells are loaded, we observe nonspecifically bound drug in the cytoplasm, whereas the bound drug is present in the nucleoli, where PARP accumulates. The weighted fluorescence anisotropy images are color-mapped using the weighted RGB color-mapping scheme illustrated in the Experimental design section. Scale bars, 17 µm.

